Category Archives: Uncategorized

Programming the Cloud with Microservices, Docker and Mesosphere

Introduction

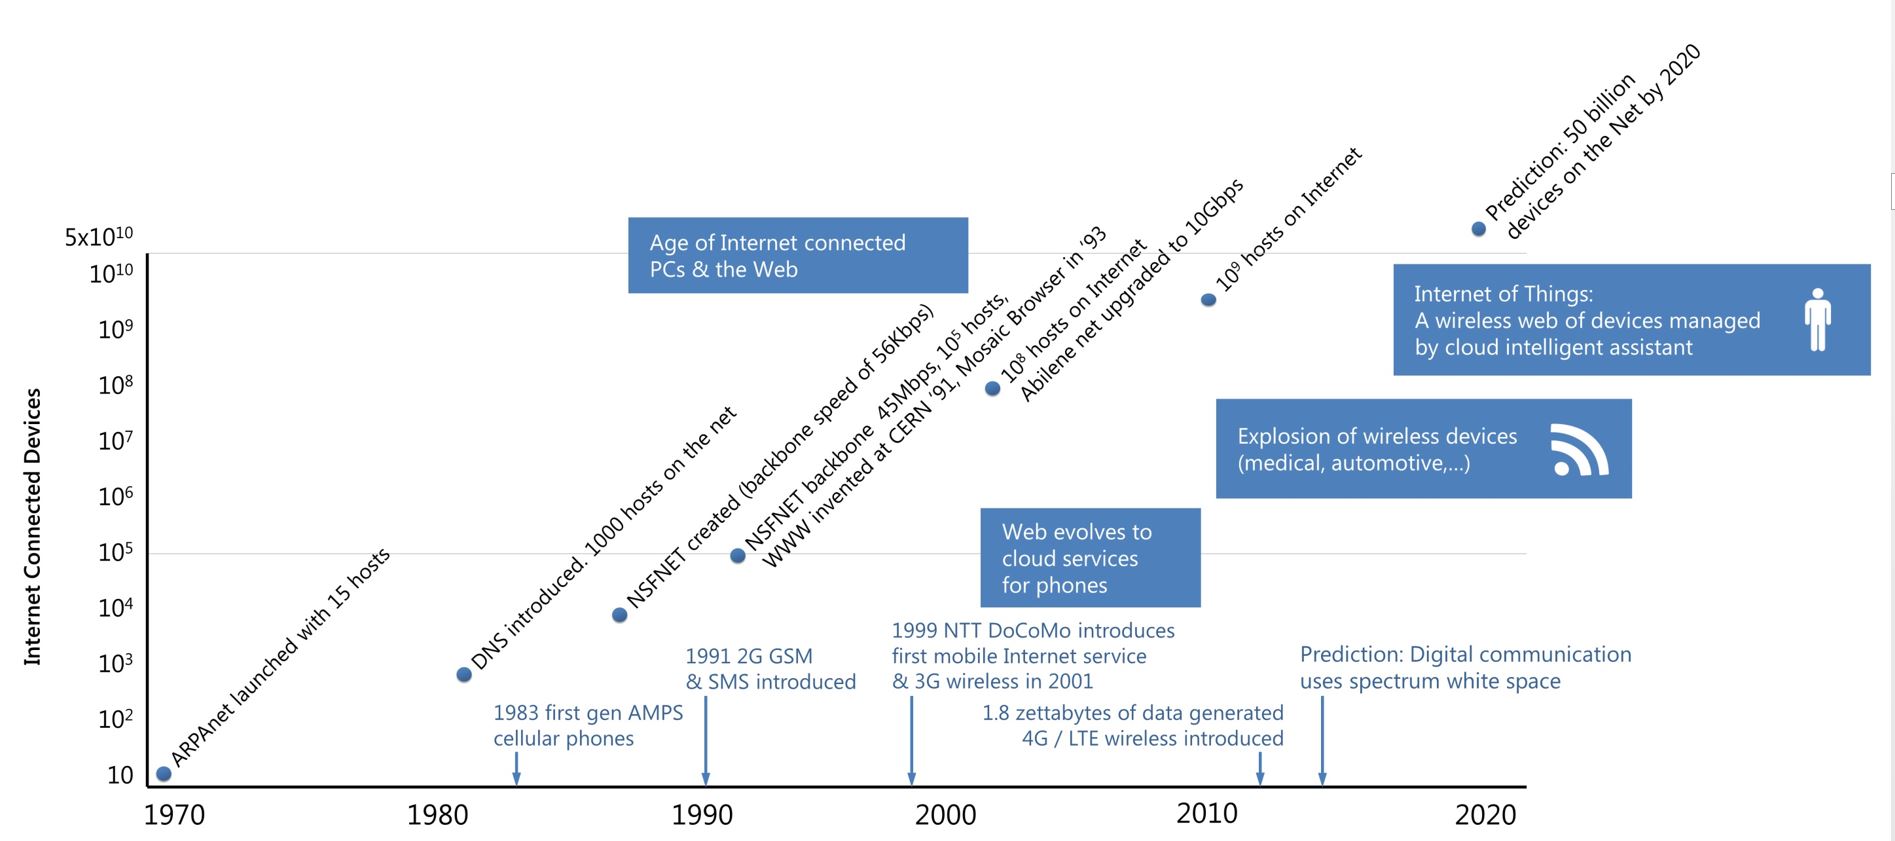
The cloud is designed to be a host for applications that are realized as scalable services. For example a web server or the backend of a mobile app. In this case the application accepts random connections from remote clients and, based on the client’s request, it does some computation and returns a response. If the number of clients that are concurrently requesting service grows too large for one server to handle, the system should automatically spawn new instances of the server to share the load. Another scenario is an application that processes events from remote sensors to inform a control system on how to respond.   For example, geo-sensors detecting ground motion tremors occurring in a significant pattern, then sound an earthquake warning.   In this case the cloud part of the application may involve multiple components: sensor signal decoders, pattern analysis integrators, database searches, and alarm system interfaces.   Another example is a large-scale data analytics system processing large amounts of text data. For example, a search index for the World Wide Web.

Each of these cloud applications illustrates one of three basic paradigms of programming the cloud. They are

Basic web server gateway. A single server that responds to requests from a user. Scaling is accomplished by replication. We will discuss this further in another section on Dockerized Science Gateways.

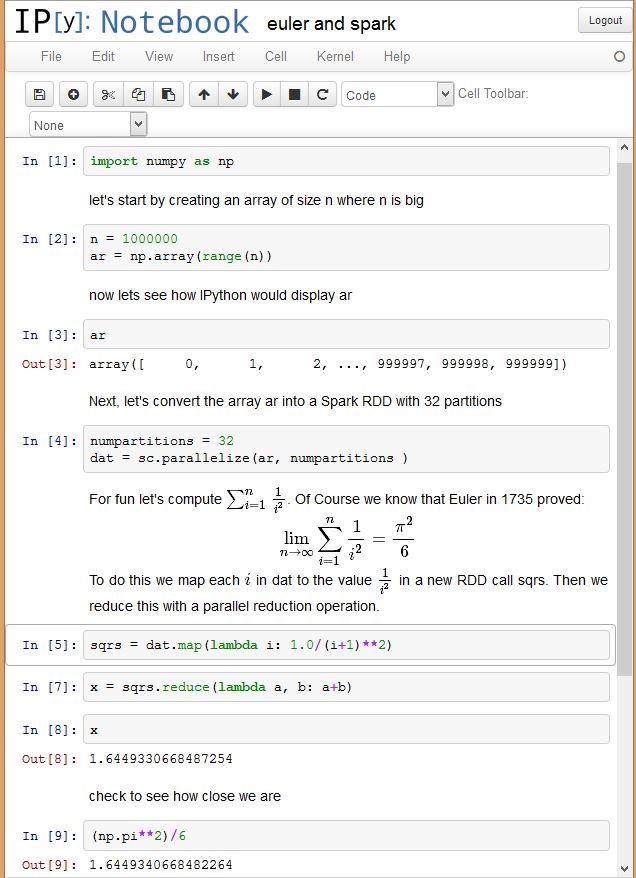
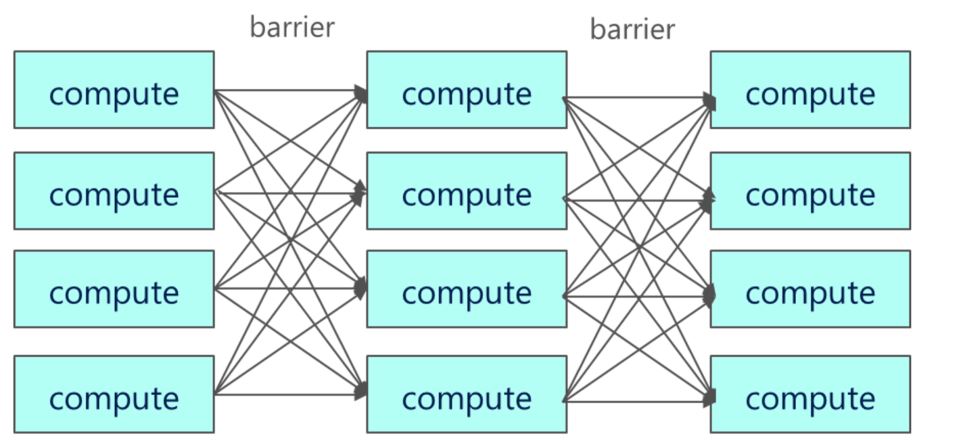
Bulk Synchronous Parallel methods. This is a very old and respected model for parallel programming characterized by running computation in a sequence of phases where each phase involves a single task that is executed in parallel on multiple servers. When the tasks terminate a barrier synchronization is used to permute the data so that the second phase of computation can begin.   For example, Spark commands from the Scala REPL or Python API operate on distributed data collections in this manner.   Hadoop Map Reduce is essentially a BSP program.

bsp

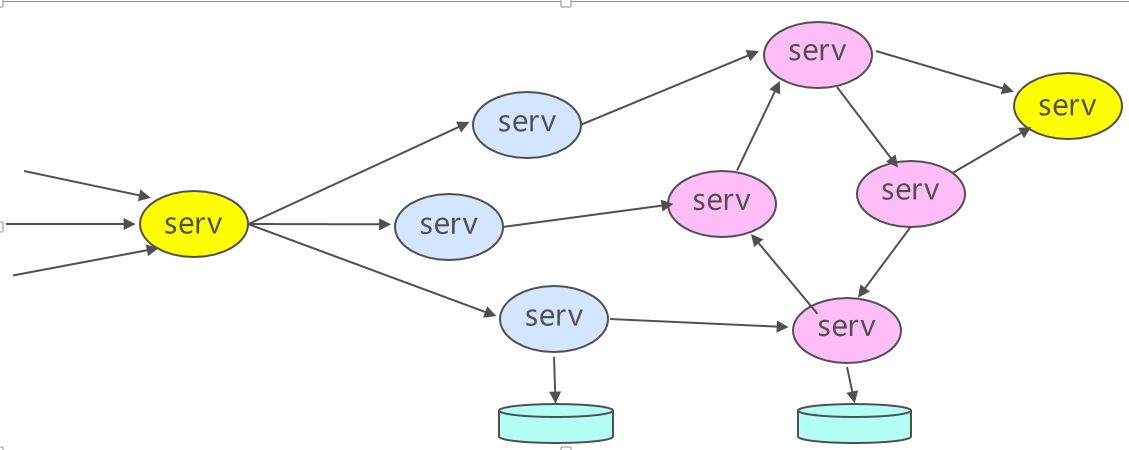
An asynchronous swarm of communicating processes distributed over a virtual network in the cloud.   The individual processes may be stateless, such as a simple web service or stateful such as found in the actor programming model.

async-swarm

An excellent example of a tool for programming asynchronous swarms via actors is Orleans from Microsoft Research http://research.microsoft.com/en-us/projects/orleans/.   Orleans has been used internally at Microsoft on some very large scale projects including the game Halo Online and it is now available as open source.

Microservices

Recently this asynchronous swarm style has been rebranded with a new philosophy under the name “Microservices’’. The problem addressed by microservices is that of how to design and build a large, heterogeneous app so that it will be secure, maintainable, fault tolerant and scalable? This is particularly important for very large, on-line services that need to support thousands of concurrent users. The app must remain up twenty-four hours a day but still maintained and upgraded. The software engineering approach to this problem is called “Dev Ops” and it integrates product delivery, quality testing, feature development, and maintenance releases in order to improve reliability and security and provide faster development and deployment cycles.   From the programmer’s perspective this is a “you built it, so now you run it” philosophy. Updates to parts of this system occur while the system is running so there is a very tight integration of the developers with the IT-pros managing the system.

The microservice solution to this challenge is to partition the app into small, independent service components communicating with simple, lightweight mechanisms. The microservice paradigm design rules dictate that each microservice must be able to be managed, replicated/scaled, upgraded and deployed independent of the others microservices. Each microservice must have a single function and operates in a “bounded context”, i.e. having very limited responsibility and limited dependence on other service. When possible one should reuse existing trusted services such as databases, caches, directories, etc. All microservices should be designed for constant failure and recovery. The communication mechanisms used are varied and include REST web service calls, RPC mechanisms like SWIFT and the Advance Message Queueing Protocol AMQP system that are common in IoT applications and are well supported in the commercial clouds.

The microservice philosophy has been adopted in various form by many companies including Netflix, Google, Microsoft, Spotify, Amazon and others.

Docker, Swarm, Kubernetes and Mesosphere

To build a substantial microservice application one needs to build on a platform that can manage large collections of distributed, communicating services. Thanks to the open source movement we now have an excellent collection of tools for building and managing microservices.   These are

  1. Containers. This revolutionary technology that allows us an alternative to deploying services as heavy-weight virtual machines.   “Containers” run on a host OS and use basic services such as kernel namespaces and resource isolation provided by that OS. Docker containers contain all the OS components and libraries needed by the app, various user-added files and apps and instructions for what process to run. Docker exploits the host OS namespaces for isolation, control groups for resource management.   It uses the Union File Systems so that containers are built as layers on existing FS. The company Docker.com also provides a registry of dockerized tools and application that can be downloaded. We show an example of using Docker and the registry in another section.
  1. CoreOS. As noted the host OS for Docker need not be very heavy because each container will have its own OS features and libraries required by the application. CoreOS is a basic “stripped down” version of Linux that contains only those tools needed to support Docker containers.

The tools for managing clusters of microservices hosting containerized microservices are many.   The ones we have tested are

  1. Swarm. Docker.com provides a tool for managing clusters of servers running Docker container instances. We tested Swarm on Azure using the client Docker-machine and it was relatively easy to bring up a cluster of machines and deploy apps.   Swarm shows great promise but it is still beta quality and we found the documentation still rather sparse.
  2. Kubernetes was recently released by Google and is based on the cluster management tools they use. We also found it relatively easy to deploy Kubernetes on Azure using another tool called Weave to support the networking.   Kubernetes has an important feature not present in the other microservice cluster management tools.   In Kubernetes every container lives inside a “pod”.   Pods can contain a single Docker container instance or several instances.   This is important because often a single microservice instance may always collaborate with another microservice instance of the same or different type. For example a Dockerized web server may need a private instance of a Redis cache or SQL database.   These are relatively standard docker components, so there is no reason to deploy them in your web server container.   Because each pod instance runs on a single server, the containers in the same pod share resources such as private directories. Communication within a server is going to be faster and more reliable than communication across the network.
  3. Mesosphere. One of the many products from the UC Berkeley AMP lab was a distributed computing operating system (dcos) called Mesos.   It has since been spun off as a startup called Mesosphere.com.   Mesosphere installed easily on Azure and it has proven to be extremely reliable.   Because we use it so extensively we have an addition page about it here.
  4. Microsoft Azure Service Fabric. Microsoft recently released a development kit for a microservice orchestration framework that they have been using internally for a while. The SDK is easy to install into visual studio and it comes with an emulator so you can start building apps. I have not yet had a chance to try the full deployment.   Mark Russinovich has a nice blog about this and an online video of a talk he gave describing the system.

In the next post, we will describe our experience building a microservice application to do document classification using machine learning tools.   However if you want to get a feeling for how one can use Mesosphere and Python to build simple microservices, then we have a page where we show you all the gory details.  It is called “Fun with Mesosphere and Microservices“.

A Cloud Gathering and Reflections on a Panel.

There are a lot of Cloud computing conferences these days. IEEE Cloud 2015 will be held in New York on June 27th and the ACM Symposium on Cloud Computing will be held in August in Hawaii and various regional conferences and workshops on cloud themes abound. The 2015 IEEE International Conference on Cloud Engineering was held this last week in Tempe Arizona, USA. This is the third instance of the conference and there is every indication that it is gathering a reputation as a strong, technically oriented event.

Environmental Sustainability and the Cloud

There were several interesting research trends that were apparent at this year’s event.   The first of these was a clear recognition that cloud engineering is much more than the mechanics of data centers construction and optimization.   Highlights of the meeting included two panel sessions. One panel led by HJ Siegel looked at the issue of sustainability.   My assumption was that this was going to be a discussion of business models for cloud vendors, but the topic that was discussed was much more interesting. Can the expansion of cloud infrastructure keep pace with our exponentially growing demand for new apps and services? Can the planet sustain the growing energy requirements of the cloud?  Or is a positive side to the story? The data center is just one part of the big cloud of interconnected devices and networks.    The public cloud vendors have been working for several years building data centers that are driven by renewable energy such as wind, geothermal, hydroelectric and solar and many of the newest data centers are carbon neutral.   But the data centers are only a one part of energy used by our ubiquitous information-rich lives.   Getting the data on how much energy is used by our systems is a non-trivial task. One fascinating report is provided by Greenpeace (April 2014). In terms of shares of the total pie of cloud related energy consumption the cloud data centers represent about 20% of the total, the network itself represent about 23% and the remaining 57% is consumed by our devices.  In terms of total global energy demand the cloud ranks 6th in total use (behind China, US, Japan, India and Russia and ahead of Germany, Brazil, Canada France and the UK.) This world-wide cloud generates 2% of global emissions which is apparently similar to that produced by the global aviation sector.

There are some surprising observations that have been made about the way the cloud uses energy. A McAfee’s report “The Carbon Footprint of Spam” concludes that approximately 62 trillion spam emails are sent each year consuming 33 billion kilowatt hours of electric power which translates into greenhouse gas emissions equal to 3.1 million cars on the road using at least 2 billion gallons of gasoline. Streaming data sources also account for a large part of the cloud traffic.   Netflix and YouTube together account for 47% of prime time internet traffic. According to the digital power group, streaming an hour of Netflix every week uses more power than two refrigerators running for a year. And a growing number of data-collecting cell phone apps are sending vast streams of data back to the app developers. One participant at the meeting referred to this as the “dark matter” of the Internet.

Geoffrey Fox led a second panel at the conference that took up the topic of the “Internet of Things (IoT)”.   It is anticipated that 50 billion devices will be on the network by 2020. This number represents a continuation of the exponential growth of the cloud as shown below.

iot_size

The potential for overloading the communication fabric and adding additional stress on the environment is there, but there is also great potential for the IoT to help us manage our planet and its use of resources.   Cities are becoming “smart” and using sensors and instruments to better manage and plan our urban environments. Urban Science is growing as a data intensive discipline. But the IoT goes well beyond our urban areas. Data gathering instruments in sensitive ecological zones can monitor human impact and alert us to ways we must take action.   We are starting to see progress on the ocean observing network of sensors that can help us better understand the impact of climate change on aquatic life.   One topic that came up in the panel is an observation that the cloud data centers cannot be the home for all of this IoT data.   We must continue to build data analysis facilities at the edge of the network to do initial analysis and response. Large scale data analysis can be done on summarized data streams in the big data centers.   Elizabeth Kolbert in her new book makes the argument that we are in the middle of the sixth great extinction and human impact is the cause. Unless we can understand the planet — and our impact on it — as a single system, we have little hope of avoiding some very bad outcomes.   This IoT is becoming one of the key instruments needed to understand this system.

Back to Cloud Engineering.

Sustainability and the IoT were certainly not the only contributions of the meeting. The conference had very interesting sessions on security and modeling and simulation and other engineering topics.   In addition there were attached workshops on software defined systems and container technology for clouds.   The conference concluded with a brilliant keynote talk by Douglas Terry on important and practical models of cloud data consistency.

The conference next year will be in Berlin.   It should be fun.

Docker and Containers of Science.

A few years ago we thought that the best way to encapsulate software for deployment in the cloud was to create a virtual machine image and store it in a repository for Amazon images or the Microsoft VM depot. Then anybody could grab the image and spin it up on the appropriate data center. Unfortunately virtualization tools are not all the same, so running a VM from Amazon on Azure or other cloud was a real problem. I sat through endless debates with my science colleagues that usually went something like this. “This is just another form of evil vendor LOCK-IN!” We spent a great deal of time thinking about ways to address this evilness.

While this was going on other folks realized that the Linux Kernel had some cool features like namespace isolation and control groups that provides ways to bound the resource utilization of processes. By the middle of 2013 a little company called dotCloud released a tool that would provide a better way to deploy encapsulated application and this became Docker and Docker, Inc. Microsoft also figured out how to do the same thing with Windows and they are said to release a Docker capable version of Windows Server soon.

What is Docker and why does it change the game? Docker allows applications to be provisioned in “containers” that encapsulate all application dependencies.   The application sees a complete, private process space, file system and network interface that is isolated from applications in other containers on the same host operating system.   Once the basic Docker framework and library are installed on the host OS, loading and bringing up a container stored in the Docker archive requires one command and takes only as long as it takes to download the container binary.   Because container images are so much smaller than a VM image, the download is very fast. And starting a new instance of a cached container image takes only a few seconds. Docker isolation provides a great way to factor large applications and there are simple ways for running containers to communicate. (This is a great way to avoid the “jar hell” that was so common in big Java applications when different app components require libraries or environments that are in conflict.) It took only a few mouse clicks to install Boot2Docker on my little Microsoft Surface and another minute to spin up a container with the IPython notebook. (If you try this at home, note that Boot2Docker conflicts with Hypervisor so you need to turn HyperV off.) To make life even easier another new company called CoreOS has a stripped down distribution of Linux that is designed for large-scale cloud deployment and Docker is built-in.

Docker is designed to support a variety of distributed applications and it is now widely used in the “Internet industry” (including folks like YELP*, Spotify, Baidu, Yandex, eBay) and supported by the public cloud providers Google, Microsoft, Amazon and IBM.   Loading CoreOS as a VM on Azure was easy and bringing up Docker instances on it was trivial.

Where’s the Science?

At this point many of you readers may say, “We know all this. Where have you been the last year?” The point of this post is to call out the impressive collection of scientific applications that have been containerized. My exploration of this began with a nice chat I had with two bioinformatics researchers who were interested in using a public cloud for their work. I asked them which tools they were using. They told me and I thought there must be Docker containers for that software. Sure enough, they were there.   In fact there are example that are appearing every day.   Here is a short list that I found on the Docker repository.

  • Radio Astronomy tools including containers for LOFAR, pyimager and meqtrees.
  • Chemical Informatics libraries from the chemtoolbox
  • Bioinformatics. The ever popular Galaxy toolkit is available in various forms. The University of Hamburg genome toolkit is also available.
  • For Mathematics and Statistics there is, of course, R and Python with numpy etc in various combinations.
  • For Machine Learning there is the complete collection of ML algorithms written in Julia, many versions of Spark, the Vowpal Wabbit tools and the Scikit-learn python tools.
  • For Geospatial data there is a container with geoserver
  • For digital archival and data curation there is a container for dspace and irods
  • The NSF iPlant consortium has developed the Agave science-as-a-service platform and the various components of that are now containerized.

Each of these allow you to spin up a running instance of the software in seconds on a Docerized server like CoreOS or Ubuntu (after a Docker install) or Windows with Boot2Docker.   So all the problems of science in the cloud are solved. Correct? Of course not. What if you want to run a cluster of Docker Containers that are sharing you large workloads? Or running a big Spark deployment?

The challenge with Docker is managing multiple Azure servers each with multiple Docker containers.   There are four major open source solutions to this problem.

  • Mesos is a distributed systems kernel for managing large numbers of servers.   Originally developed as part of the Berkeley Amplab, it is now supported by a startup, Mesosphere.
  • Kubernetes is a technology released by Google and endorsed by Microsoft and others.   Kubernetes is designed to manage groups of containers. It allows users to ask a cluster to run a set of containers. The system automatically chooses hosts to run those containers on.
  • Weave is an overlay network for Docker that allows Docker clusters from different data centers or even different cloud vendors to be tied together.   Weave runs on Google and AWS and Weave has been ported to Azure by Patrick Chanezon.
  • Swarm is another tool developed by the Docker team to manage a cluster of containers. We know of no ports of Swarm to Azure.

These tools can be used together in various combinations.   In our next post we will report on our experience using these tools to build a cluster application.

One final note.  Docker does not solve the entire vendor Lock-In issue.  There is still the data.  Depend upon where you put big data collections the laws of computational physics will draw your computing to it.  At least Docker makes it ease for that computing to move.

UPDATE:

Henrik Nordborg just pointed me to TheUberCloud were a very large number of containerized science and engineering application have been deployed on a number of cloud platforms.  More details later when I have a better  understanding of what they have done.  What I see now looks very impressive.

Interactive Data Analysis with Spark in the Cloud with Brisk

In this post we explore the IPython notebook on Azure via Elastacloud’s new Brisk Spark Service. We also look at Spark’s parallel scalability performance using a simple example.

Data analytics is about data exploration and that is an activity that is best done interactively. By interactive exploration we mean the ability to load a dataset into a system and then conduct experiments with different transformations and visualizations of the data. Interactive systems allow you to apply different analysis or machine learning algorithms and then experiment with different parameters to optimize the results. We have had great desktop tools for interactive data analysis for many years. Excel, Matlab, R, Mathematica are all superb in that they integrate a great computational library with graphics.   Mathematica demonstrated the power of journaling data exploration with an interactive electronic notebook. And the Scientific Python community has rallied around the IPython notebook.  This notebook is actually a web server that allows your browser to host the notebook files that you can interact with while Python runs in the background.   The good folks at Continuum Analytics provide the Anaconda package that contains all you need to deploy the Python, IPython, the scientific libraries including numpy, scipy and scikit-learn and the IPython notebook.   It is trivial to run the notebook on your laptop and interactively build and visualize python data analysis solutions. Individual notebooks can be published and shared with the notebook viewer nbviewer.

There is a major limitation to these desktop computing solutions. They are limited to the computing power and data capacity of your personal machine.   “Big Data” is a term that is frequently used without a precise definition.   I believe there is a very reasonable translation.   “Big Data” means too big to fit on your laptop. And the way you handle big data is to distribute it over multiple compute and storage nodes where you can apply parallel algorithms to the analysis.

If you have a supercomputer, you can submit batch analysis jobs, but if you want an interactive experience you must have a way for the user to submit individual commands to be executed followed by a response from the machine before another command is sent. This pattern is called a “read-eval-print-loop”, or REPL and the idea is as old as the hills. But for big data problems you need to do this with the user at a web browser or desktop app communicating with a massively parallel analysis engine in the back end. This has been done using Matlab clusthinkerclustertering and the IPython notebook has a built-in parallel cluster tool.   More recently there is great interest in Torch and the LuaJIT programming environment. Torch is extremely strong in machine learning algorithms and exploits GPU parallelism with an underlying C/CUDA implementation.

Spark with IPython Notebook.

In this blog I want to talk about my experience using the IPython Notebook with the Spark analysis framework. Using the IPython notebook with Spark is not new. Cloudera described this in a blog post in August of 2014 and it is described in the Spark distribution. My goal here is to talk about how it fairs as an interactive tool for data analysis that is also scalable as a parallel computing platform for big data.

Spark is a product of the very prolific Berkeley AMP lab. It is now supported by Databricks.com who also provide an on-line service that allows you to deploy an instance of Spark on an Amazon AWS cluster. The Databricks Workspace contains a notebook that support SQL, Scala (the implementation language for Spark) and IPython. This same workspace also includes a way to transform a notebook into an online dashboard with only a few mouse clicks. This is an extremely impressive tool. Databricks is not the only company to make Spark a cloud service. The U.K. company Elastacloud has produced a new Brisk service that provides Spark on Microsoft’s Azure cloud. I will focus my discussion on experience with Brisk and a simple deployment of Spark on a 16 core Azure Linux VM server.

I describe Spark in greater detail in another section, however a brief introduction will be important for what follows.   Spark is a cluster data analysis engine that consist of a master server and a collection of workers. A central concept in Spark is the notion of a Resilient Distributed Dataset (RDD) which represents a data collection that is distributed across servers and mapped to disk or memory. Spark is implemented in Scala which is an interpreted statically typed object functional language.   Spark has a library of Scala “parallel” operators that perform transformations on RDDs.   This library also has a very nice Python binding.   These operators are very similar to the Map and Reduce operations that were made popular by the Hadoop data analysis engine.   More precisely Spark has two types of operations: transformations which map RDDs into new RDDs and actions which return values back to the main program (usually the read-eval-print-loop).

To illustrate these ideas look below at a sample from an IPython notebook session using Spark. In this example we create a one dimensional array of integers and then we convert this to an RDD that is partitioned into 32 pieces.   In Spark the partitions are distributed to the workers. Parallelism is achieved by applying the computational parts of Spark operators on partitions in parallel using workers and multiple threads per worker.   For actions, such as a reduce, most of the work is done on each partition and then across partitions as needed.   The Spark python library exploits the way Python can create anonymous functions using the lambda operator.   Code is generated for these function and they can then be shipped by Spark’s work scheduler to the workers for execution on each RDD partition.   If you have not seen the Notebook prior to this, it is fairly easy to understand. You type commands into the cells and then evaluate them. The commands may be Python expressions or they may be Markdown or HTML text including Latex math.   This combination of capabilities defines how the notebook can be used.   One can execute a Spark or Python command then make a note about the result. You can then go back to a previous step and change a parameter and rerun the computation. Of course, this does not capture the full range of data provenance challenges that are important for science today, it is a great step towards producing an executable document that can be shared and repeated.

notebook_sample

Spark on Microsoft Azure

I deployed Spark with the IPython Notebook on Microsoft Azure in two different ways.   In the first case I took the standard spark 1.0 download, together with Anaconda and deployed it on an Azure D14 instance (16 cores, 112GB ram, 800 GB disk.)   This instance allowed me to test Spark’s ability to exploit threads in a multicore environment.   Spark is executed on a Java VM and threads in Java are used to execute the tasks that operate on partitions in an RDD.

The second deployment was made possible by the Elastacloud team and their new Brisk service.   Using Brisk one can create a spark cluster with on Azure with a few mouse clicks. The Azure usage is billed to your regular Azure accounts. Once your cluster has been created you are presented with a dashboard with links to important application monitoring tools.   I created small demo Spark cluster consisting of two nodes with four core each.   (In future posts I hope to have results for much larger clusters.)   After logging on to the head node I was able to install the IPython notebook with about a dozen steps.   (The Elastacloud people are considering the addition of the notebook as part of their standard package in a future release, so a separate installation will not be necessary.)Brisk2

How Scalable is Spark?

To answer this question I set up a notebook that contained the standard Spark Python demo implementation of the KMeans clustering.   This is a very elegant, simple demonstration of a loop nest of data parallel operations. It is not the optimized version of KMeans in the latest release of MLlib for Spark. I am using this demo because we have all aspects of its implementation at hand. I will describe the details of the computation in another page.   I measured the performance across four data sets each consisting of n points randomly chosen in an annular band around the origin in 2D space.   The values of n for each of the data sets were 100,000, 1,000,000, 10,000,000 and 100,000,000 respectively.

First a few caveats. Doing KMeans on a set of 100 million 2D points could seldom be considered a really useful operation. But as a simple test of a systems scalability we can learn a few things.   It is also important to ask how does Spark compare to the best I can do on my desktop machine? (In my case a mid-sized windows laptop.) So I wrote a small program that used the nicely optimized Scikit-Learn version of KMeans.   I ran it against the same data.   The results were as follows.   Scikit-Learn was over 20 times faster than the naïve demo implementation of KMeans for the two smaller data sets! But the desktop version could not even load and parse the big files in a reasonable amount of time.   So by my earlier definition, these qualify as “big data”.

Scalability really refers to two dimensional properties of a system and an application.   One dimension relates to how the application performs as you increase the available parallel resources.  The other dimension is how the application performs as you increase the size of the problem it must solve. These things are related as we will show below.

There are really two parameters that increase opportunities for parallel computation in Spark.   One is the total number of available cpu cores and how they are distributed over worker servers.   The other parameter is how we have partitioned the RDDs.   If we let k be the number of partitions of the data and let W be the amount of total time needed to execute the program when k = 1. If k is less than the number of available cores to do the computation and if the work divides up perfectly, the time to complete the execution will be W/k. This assumes that one cpu core is available do to the computation on each of the k partitions. However, work does not divide up perfectly. Reduction operations require data shuffling between workers and task scheduling overhead increase as k increases.   If we assume that overhead is a function of k and the number of available cores p, f(k,p), then the total time will be

eq1

We can then ask about the idea speed-up: the factor of performance improvement from one partition to k.

eq2

But this formula is only a rough guide as it does not factor many other system variables.   However, it does tell us that as w grows to be much larger than kf(k,p) then for k < p we can expect approximately linear speed up with the number of partitions.  As k grows bigger than p we expect that the speedup will be bounded above by p. A factor not accounted for here is opportunistic scheduling or more efficient use of cache when the size of each partition becomes smaller. Hence it is possible that for some k > p, the speedup will continue to grow. In the plot below we show the speedup behavior on our 16 core Azure server. There are two lines: the top represents the performance of our KMeans on the one million point dataset where the number of partitions of the data is on the x-axis. The line below is the performance on the 100K dataset.   These numbers represent averages for a small number of tests, so there is little statistical significance, but it is worth noticing three things.

  • Both data sets reach a maximum speedup near 16 partitions which is equal to the number of cores and by the time you reach 32 partitions the overhead is dragging down performance.
  • For the 1M point dataset the speedup exceeds k for k=2, 4 and 8.   This may represent more efficient scheduling behavior due to the smaller size of the partitions.
  • The 16 core server was unable to complete the execution of the 10M data set size because the java heap size limits were exceeded.   (I was unable to figure out how to set it larger.)

The bottom line is that we do see scalability as the size of the problem grows (up to the heap size limit) and as we adjust the number of partitions.

16corespeedup

On the Brisk implementation we see greater scalability due to the fact that it is a cluster implementation.  The Brisk implementation was able to handle the 1M, 10M and 100M data set sizes while the total core count was only 8.   The maximum speed-up was around 8 and that was achieved with 16 partitions. In fact, the speedup curves were so close to each other they could not be plotted in 2D.

Briskspeedup

Additional Comments

The experiments described above do not constitute a proper scientific analysis, but they were enough to convince me that Spark is a scalable system that works well as a back end to the iPython notebook.   But there are several areas where much more needs to be done.   First, the size of these deployments are extremely small.   A proper study should involve at least 32 workers with 4 to 8 cores each. Second, these tests would be much better with optimized versions of the algorithms.

The NSF Cloud Workshop

On December 11th and 12th the NSF hosted a workshop on experimental support for cloud computing.   The focus of the event was to acquaint the community with two new and exciting cloud research testbeds.   One project is the Chameleon cloud and the other is the CloudLab  project.   These two very interesting projects grow out of two different communities of researchers, but the both seek to satisfy some important goals.   Chameleon is an evolution of the FutureGrid project and led by Kate Keahey of the Computation Institute of the University of Chicago and Argonne and Dan Stanzione of the Texas Advanced Computing Center.  Additional participants include Joe Mambretti from Northwestern, D.K. Panda from Ohio State, Paul Rad from UT San Antonio and Warren Smith from UT Austin.  CloudLab is the result of a collaboration of the University of Utah, Clemson University, the University of Wisconsin Madison, the University of Massachusetts Amherst led by Robert Ricci, Aditya Akella, KC Wang, Chip Elliott, Mike Zink and Glen Richart.   CloudLab is really an evolution of aspects of the long running and successful NSF GINI project.

With one project coming from the tradition of high performance computing and the other from the world of advanced computer networking, I was expecting to see a fairly divergent set of plans.   Instead what we saw was a pair of well thought out infrastructure facility designs that can support the systems research community  very nicely.

The two facilities are different but they are also complementary.   CloudLab emphasizes a more heterogeneous set of resources.  For example it includes a subcluster that is based on low power ARM processors and even some FPGA support on another subcluster.    Chameleon  is a distributed by homogeneous system with part of it housed at Argonne and rest at TACC.    Both projects make extensive use of software defined networks and Internet2 to provide high bandwidth networking between sites.  And both provide bare metal to Openstack-based software stacks.

An important point was made about the role of these two facilities in the nations cyber-infrastructure.  These facilities are not designed to replace access to public clouds like those from Amazon, Google and Microsoft.  Nor are they intended to serve the same HPC workloads as the NSF Supercomputers. They are designed to provide a platform for the basic systems research that cannot be carried out on these existing resources.   For example,  consider research that optimizes the cloud software stack.   Or applications that explore  dynamically moving computational loads across geographic regions or offloading computationally intensive tasks to dedicated HPC resources.  For example, can we transparently migrate large machine learning tasks from the Chameleon cloud to the TACC supercomputer?   How can we optimize the storage system so that large data collections can be prefetched and streamed to computational analytics as it is needed?  How does one optimize  virtualization to support new analytics algorithms that can utilize FPGAs or GPGPUs?

The workshop itself allowed the community to present ideas for applications of the infrastructure.  One presentation from Amit Majumdar described the Science Gateway project from the XSEDE NSF Supercomputing collaboration.   The Science Gateways provide web interfaces to application domain tools.  Together the science gateways support about 1/3 of the XSEDE scientific users.  For example, CIPRES is a science gateway for phylogentics research and NSG is a gateway for computational  neuroscience.  CIPRES provides access to several high performance parallel codes for inference of large phylogenetic trees through a web interface.  This is a perfect example of how a cloud infrastructure and a supercomputing facility can work together.   Clouds were created to support thousands of concurrent users and Gateway web interfaces are a perfect use case.  The gateway can support hundreds of “small” (32 core) parallel runs submitted by users and bigger computations can be submitted to the supercomputing queue.  NSG provides similar  services to the neuroscience community.  These and other gateways also  provide tools for scientific communities to share data and collaborate.  Again this is a perfect cloud application.   The only real concern I have is that much of what can be done with science gateways  can be also done on existing public clouds.  The challenge is to devise a research plan that makes use of the unique capabilities of Chameleon and CloudLab.

Another topic that was discussed was real-time management of data from cars and other sensor driven systems.  It is conceivable that we can redesign our entire transportation system if we can collect the data streaming from autonomous vehicles and send it to intelligent management systems that “instantly” calculate route and velocity data for each vehicle.  This is not possible with current public clouds because of latency and other performance issues.  This is a perfect topic to be supported by Chameleon and CloudLab.

Cloud and Supercomputing Big Data Research Challenges

We live in a world of data. It is generated by the sensors, cameras and other instruments that are imbedded in our environment.   It streams out of our large scale physics and astronomy experiments. We are sequencing genomes in laboratories and hospitals at an accelerating rate and, as our scientific simulations have scaled up, so has the magnitude of the data they generate.   However, the most well-known source of data are the vast collections that comes from our use of the Internet.

Analyzing this Internet data has been the overwhelming preoccupation of companies like Google, Amazon, Yahoo!, Microsoft and dozens more.   These companies built massive data center that were initially used to construct search indexes, but to improve search results, they had to do deep analysis of user intent. This activity led to breakthroughs in machine learning and big data analytics. Machine translation of natural language, automatic object recognition in images and text classification were all areas that have been fundamentally transformed by this work.   On the software side, the Hadoop MapReduce system was released from Yahoo! and has grown into a growing stack of powerful tools designed to support data analysis in the cloud data centers.

At the same time that the Internet industry was cranking out data tools appropriate for public clouds, the science community was scaling up their own data wars.   LHC began generating data and a massive global network of data reduction and analysis tools had to be deployed to study the results. Other areas of science began building systems to analyze and visualize the results of supercomputer simulations.

It is clear that the outcome of the Internet industries investment in scalable data analytics and machine learning tools are of value in the science community. In fact the open source nature of many of these tools has enabled many in the academic computer science community to make substantial improvements in the underlying algorithms. Unfortunately most academic researchers do not have access to the scale of parallel computing resources the cloud companies have at hand.   Most make do with small clusters running Hadoop.   We can do better.

There is a real opportunity to leverage the NSF’s and DOE’s investment in our national supercomputers and the availability of public cloud resources to create a new generation of data analysis services.  It may now be possible to use a hybrid approach that exploits the cloud’s superior scalable IO with the high performance of an HPC system to make another major leap in capability.  To accomplish this goal we must explore the algorithmic challenges to parallelizing the critical data analytics and ML algorithms and the system issues such as rapidly staging data to HPC systems from cloud storage, or how to build end-user tools. Among the questions that must be addressed are:

  • Where does the standard open source stack need to be extended to make advanced parallel data analysis tools available?
  • How can we build software service that allow users to easily access advanced tools for data analytics?
  • Where is there need for new algorithmic research?
  • Are there unique data analysis challenges in scientific disciplines that are not encountered elsewhere?

Future posts here will explore these issues.

Why are we here?

Science is undergoing a rapid transformation driven by an explosion of data.   The result has been the emergence of a new paradigm of scientific discovery that now stands alongside the three traditional pillars of experimentation, theory and computational simulation.  This new Fourth Paradigm is based on our ability to discover and learn concepts based on the analysis of massive amounts of data. This site will provide information and tutorials about the role scalable cloud computing and high performance computing (HPC) plays in scientific data analysis.  We will also provide information about new software technology and scalable algorithms for scientific discovery.